


2026 Los Angeles Real Estate Market Report

Scott Goshorn
Real estate runs deep in my blood.I grew up watching my mother hustle as a real estate agent in my home state of Ohio and her love of the business tra...
Real estate runs deep in my blood.I grew up watching my mother hustle as a real estate agent in my home state of Ohio and her love of the business tra...
California Real Estate Report: Price Growth Meets Limited Supply
A closer look at rising values, shifting demand, and ongoing market tightness
California’s housing market continued its steady—if slightly uneven—climb in May, with existing single-family home sales posting a 5.1% year-over-year increase on a seasonally adjusted annualized basis. While month-over-month activity softened slightly from April, the broader picture still points to a market that is holding its ground rather than losing momentum.
The bigger story, once again, is pricing. The statewide median home price reached a new record high of $930,260 in May, marking the second consecutive month of all-time highs. This continued appreciation was largely driven by stronger activity in the higher-priced segments, where luxury and million-dollar-plus homes continue to command a growing share of total sales. In contrast, mid-range segments remain more constrained, reflecting ongoing affordability pressures that continue to shape buyer behavior.
“California’s home sales softened in May as broader economic uncertainty continued to weigh on consumer confidence and homebuying sentiment... Even so, the recent easing in mortgage rates is an encouraging development, and if that trend continues, it could help bring more buyers and sellers back into the market and support a gradual improvement in housing conditions beginning in the third quarter.”-C.A.R. President Tamara Suminski, a Southern California broker and REALTOR®.
Year-to-date figures also show a modest but meaningful uptick, with sales through the first five months of 2026 running ahead of last year. While the market is not surging in any dramatic fashion, it is quietly building consistency—suggesting that buyers are still active, just more selective and strategic in their approach.
Inventory remains one of the defining constraints in today’s market. Although listings typically increase heading into the peak spring season, supply continues to lag behind last year’s levels across most of the state. This ongoing tightness is being fueled in part by the “lock-in effect,” as homeowners with historically low mortgage rates remain hesitant to list. The result is a market where well-positioned homes still move quickly, with the median days on market holding steady at just 22 days.
Regional performance was mixed but generally positive, with most major areas of the state recording year-over-year sales gains, led by the Central Coast. At the same time, inventory declines across a majority of counties highlight a continued imbalance between supply and demand, particularly in higher-demand coastal and urban markets.
“Housing supply has remained constrained in recent months as the lock-in effect continued to put many would-be sellers on the sidelines, intensifying competition and placing upward pressure on home prices...While the statewide median price typically reaches its seasonal peak in May, the recent easing of tensions in the Middle East could bring more buyers back into the market and keep price pressures up at the start of the third quarter.”-C.A.R. Senior Vice President and Chief Economist Jordan Levine.
On the pricing front, values continue to edge upward. The median price per square foot rose year-over-year, reinforcing the broader trend of gradual appreciation even in a higher-rate environment. Meanwhile, mortgage rates averaged 6.44% in May—slightly higher than April but still below last year’s levels—offering a modest improvement in borrowing conditions compared to 2025, though not enough to materially shift affordability dynamics.
Overall, the California housing market remains in a familiar position: limited supply, resilient demand, and prices that continue to push higher despite headwinds. Buyers are taking a more calculated approach, sellers are benefiting from scarcity, and success in this environment continues to hinge on precise pricing, strong preparation, and timing that aligns with today’s more measured pace of demand.
And now for the latest data on Los Angeles County real estate trends:
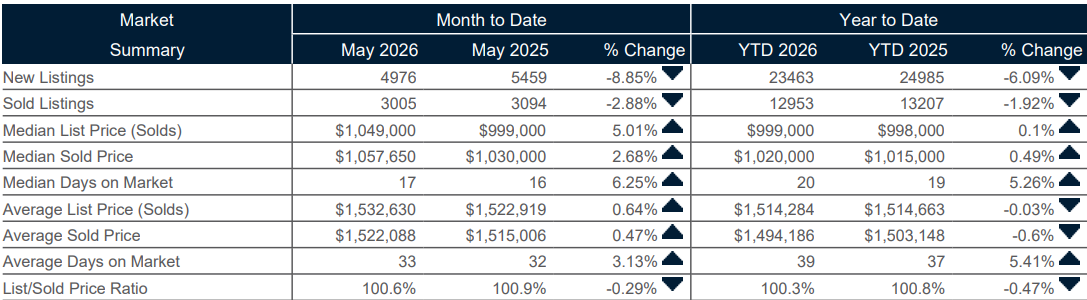
Single family homes | Los Angeles County | May 2026
New Listings: 4,976 (Down 16.60% year over year)
Homes Sold: 3,005 (Down 7.21% year over year)
Median List Price: $1,049,000 (Down .05% year over year)
Median Sales Price: $1,057,650 (Down 2.09% year over year)
Median Days on Market: 17 (Up 14.29% year over year)
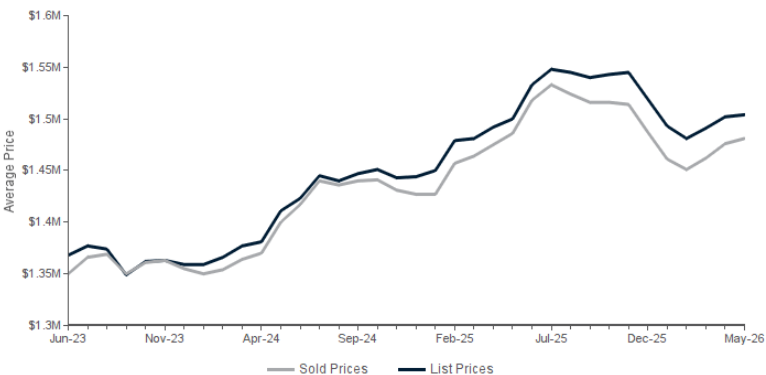
Average List Price: $1,532,630 (Down 6.62% year over year)
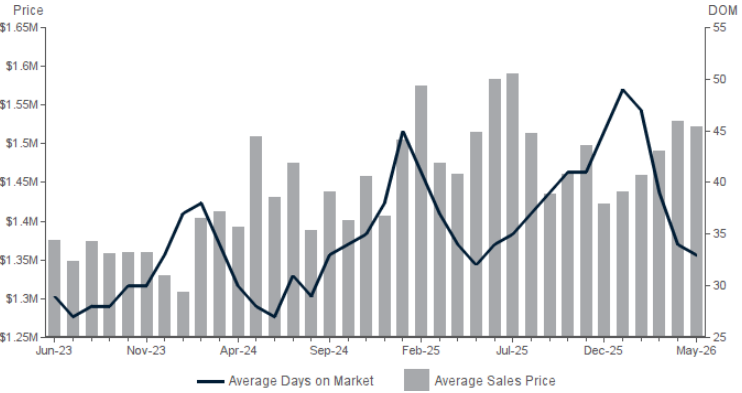
Average Sales Price: $1,522,088 (Down 7.78% year over year)
Average Days on Market: 33 (Up 9.52% year over year)
List/Sell Price Ratio: 100.60% (Down .91% year over year)
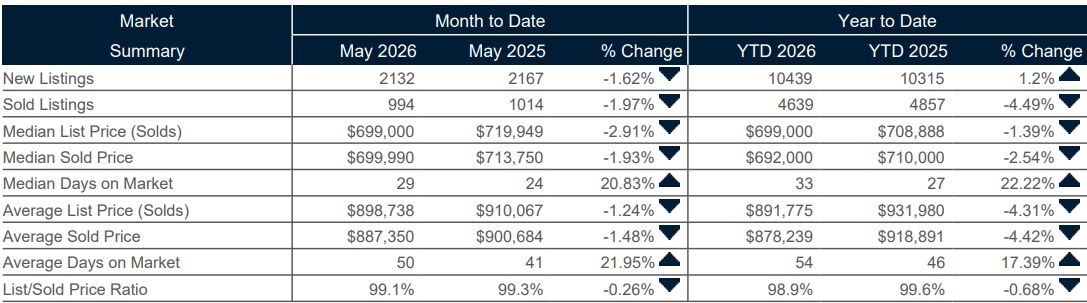
Condo homes | Los Angeles County | May 2026
New Listings: 2,132 (Down 3.49% year over year)
Homes Sold: 994 (Down 7.8% year over year)
Median List Price: $699,000 (Down 3.59% year over year)
Median Sales Price: $699,990 (Down 4.17% year over year)
Median Days on Market: 29 (Up 38.71% year over year)
Average List Price: $898,38 (Down 11.77% year over year)
Average Sales Price: $887,350 (Down 11.22% year over year)
Average Days on Market: 50 (Up 15.38% year over year)
List/Sell Price Ratio: 99.10% (Down .92% year over year)
Single Family Homes I March 2026 I Los Angeles County
Condo-Townhomes I March 2026 I Los Angeles County
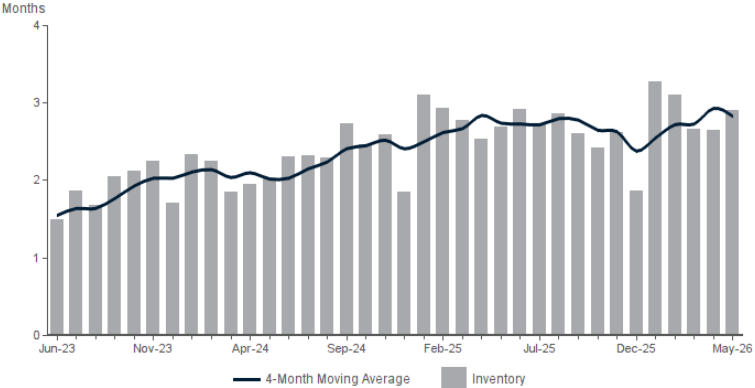
Single Family Homes I Months Supply of Inventory I Properties for sale divided by number of properties sold
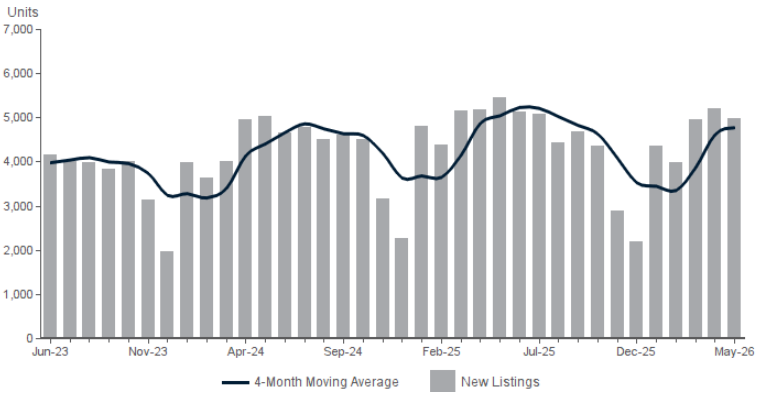
Single Family Homes I New Properties I Number of new properties listed for sale during the month
Single Family Homes I Average Sales/List Price I Average list price compared to average sold price of properties sold each month
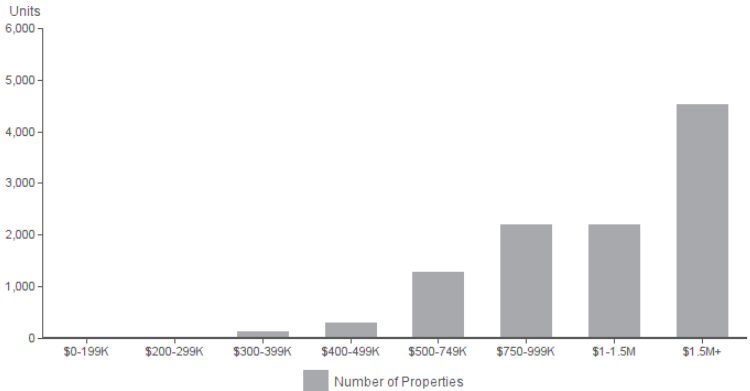
Single Family Homes I Properties for Sale I Number of properties currently listed for sale by price range
Single Family Homes I Average Sales Price and Average Days on Market
The statistics presented in the Market Report are compiled based on figures and data generated by IDC Global and Datafloat for the benefit of Rodeo Realty. Due to possible reporting inconsistencies, Days on Market (DOM), average prices and rates of appreciation should be used to analyze trends only. All information should be independently reviewed and verified for accuracy. Due to MLS reporting methods and allowable reporting policy, this data is only informational and may not be completely accurate. Data maintained by the MLSs may not reflect all real estate activity in the market. All information should be independently reviewed and verified for accuracy. Properties may or may not be listed by the office/agent presenting the information. |
Want to know what's happening in your neighborhood?
There's the state of California, the county of Los Angeles and then there's your neighborhood. If you would like a Real Estate market report for a specific zip code or neighborhood, complete this form and we'll be back in touch with you!
Thank you for reaching out!
We'll get in touch with you soon.